EUROPEAN DEMOGRAPHIC DATASHEET
The European Demographic Datasheet 2016 shows key demographic data, population trends and projections until 2050. It covers fertility, mortality, migration and population structure, including population ageing, and their changes. The datasheet combines data for all countries of Europe and for broader European regions, as well as maps, population pyramids, tables, graphs and featured thematic boxes. It pays special attention to the importance of migration for the current and future population changes across the continent and to the alternative indicators of population ageing. In comparison to the Data Sheet Poster, this online version provides expanded data coverage, additional maps and population pyramids, ranking charts and details about data sources and definitions. It also allows users to download all data and images.
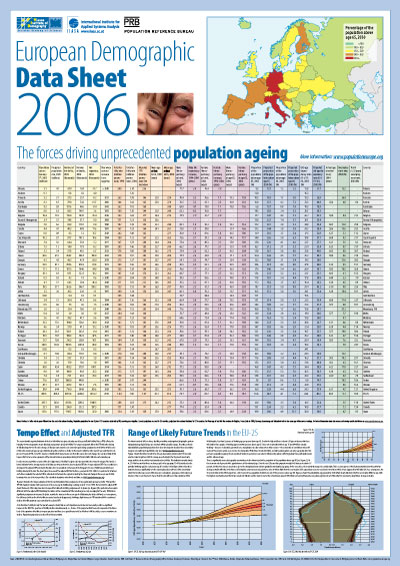
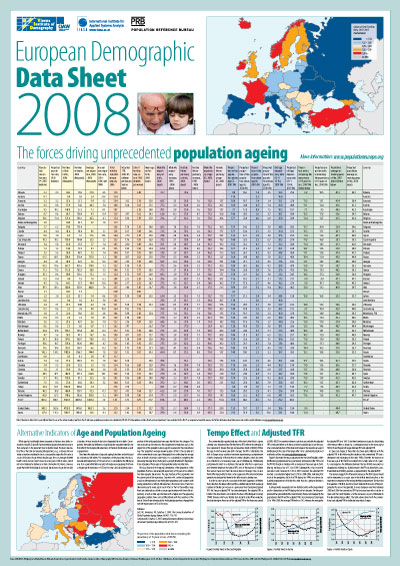
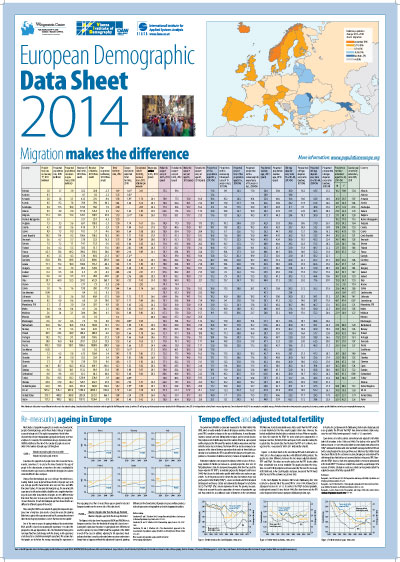
The team at the VID and IIASA prepares the European Demographic Datasheet bi-annually. Previous editions of the datasheet poster are available here.
Suggested citation:
Vienna Institute of Demography (VID) and International Institute for Applied Systems Analysis
(IIASA). 2016. European Demographic Datasheet 2016. Wittgenstein Centre (IIASA, VID/OEAW, WU),
Vienna.
TEAM
Sergei
Scherbov (responsible for content) – scientific content, population projections,
ageing
indicators
Marija Mamolo - scientific content, data collection and computation,
population
projections
Michaela
Potančoková – coordination, scientific content, data collection and computation,
population projection scenarios, cartography
Tomáš
Sobotka – scientific content, fertility indicators, population projection
scenarios
Kryštof
Zeman – scientific content, data collection and computation, fertility
indicators
Assistance: Stefanie Andruchowitz, Jakob
Eder,
Warren
Sanderson
Preparation and publication of the European Demographic Datasheet was partly supported by the European Research Council under the European Union’s Seventh Framework Programme, projects ERC-2011-StG 284238 (EURREP) and ERC-2012-AdG 323947 (Re-Ageing).
POPULATION PROJECTIONS
Population projections have always been an important aspect of the European Demographic Data Sheet since its first edition in 2006 as they illustrate the long-term effect of the present population trends and shed a light on changes due to population ageing. Projections in each data sheet are built on regularly updated data on population by age and sex, and take into account up-to-date trends in fertility, mortality and migration. The standard cohort-component model is used to project the population by age and sex from 2015 to 2050. For simplicity, a scenario with and without migration is presented in the data sheet. In this issue, the scenario with migration also considers the impact of asylum seekers.
More about population projections here.
ALTERNATIVE FERTILITY INDICATORS AND EURREP PROJECT
The period level of fertility is commonly measured by the Total Fertility Rate (TFR). However, the TFR is sensitive to changes in the age at childbearing, which has been rising in most European countries for several decades. This “stretching” of reproduction in turn depresses the period TFR even if the number of children women ultimately have over their life course does not change.
Since its very first addition in 2006, European Demographic Datasheet has featured alternative indicators to the conventional TFR. Alternative indicators were proposed to obtain a more accurate measure of the mean number of children per woman in a calendar year. The European Demographic Datasheet 2016 features two such indicators, Tempo-adjusted TFR (TFR*), proposed by Bongaarts and Feeney (1998, 2000) which is based on birth order-specific total fertility rates and mean ages at birth, and Tempo and Parity-adjusted Total Fertility (TFRp*), elaborated by Bongaarts and Sobotka (2012). You can find more information about these indicators here and here
More information about fertility research in contemporary Europe is available at the EURREP project website.
ALTERNATIVE AGEING INDICATORS AND RE-AGEING PROJECT
A better understanding of age and aging, for both science and policy, requires new approaches. This datasheet features innovative alternative ageing indicators pioneered by the project leader Sergei Scherbov and his colleagues, who have developed a new paradigm in conceptualizing population aging: the Characteristics Approach to the measurement of population aging. Since its early editions, European Demographic Datasheet has featured alternative ageing indicators such as prospective old-age dependency ratio, the share of population with a remaining life expectancy of 15 years or less, and in this 2016 edition we introduce the intergenarationally equitable pension age.
More information about alternative ageing indicators and the characteristics approach is available at the Re-ageing project website.


